Five Root Causes of Slow Embedded GUI Rendering
Select each tab to understand the cause, the cost to your project, and the Sparklet solution.
Root Cause 1: Full-Screen Redraw on Every Frame
Many embedded GUI frameworks repaint the entire display area every frame regardless of what changed. If only a clock digit updates, repainting all 76,800 pixels (320×240) to change 400 is pure waste. At 60 fps this is 4.6 million unnecessary pixel writes per second — direct CPU and bus bandwidth consumed for no visible benefit.
How Sparklet solves it: Sparklet's renderer maintains a dirty-region map. When a widget changes state — a value updates, an animation advances, a user touches the screen — only that widget's bounding rectangle is marked dirty. The render pass clips all paint operations to dirty rectangles and skips clean areas entirely. A clock page updating one digit repaints roughly 30×40 pixels, not 76,800. On mostly static screens, total pixel throughput drops by 80–95% compared to full-screen redraw.
- Default behaviour in Sparklet — no configuration required
- Applies to all widget types including transparent and overlapping widgets
- Compatible with both full framebuffer and partial buffer modes
- Link: Reduce Memory Usage for framebuffer saving alongside performance gains

Root Cause 2: Software Rendering on Hardware With a 2D Accelerator
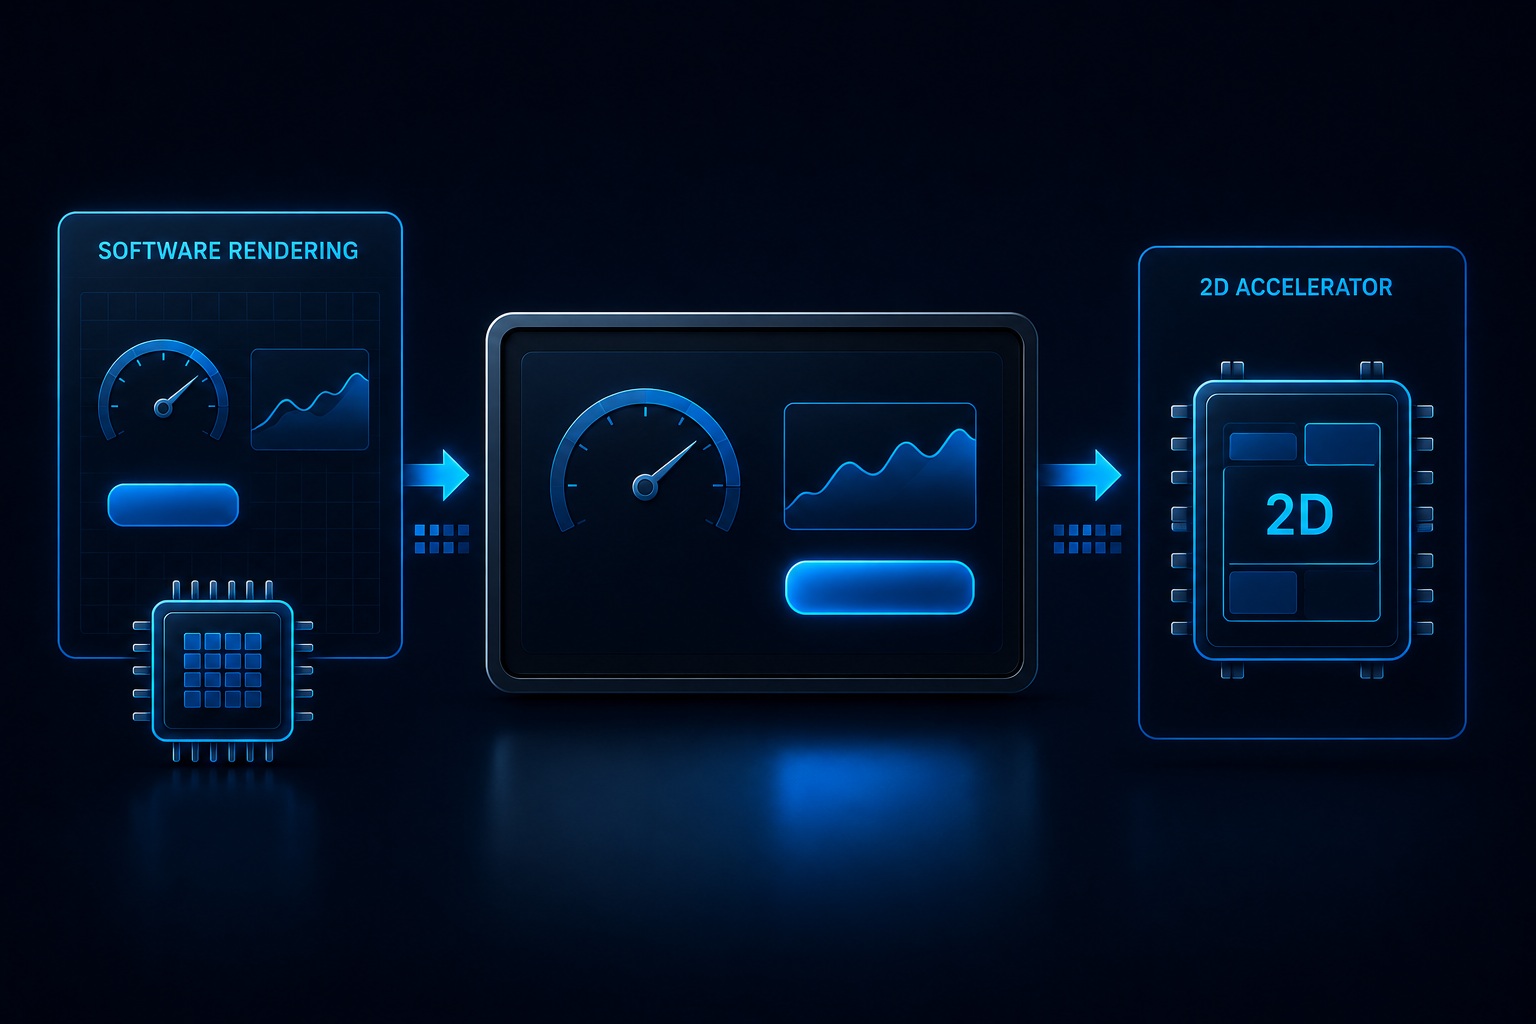
Every pixel blit, alpha blend, and rotate computed by the CPU core is 10–50× slower than a dedicated 2D accelerator. On a 320×240 RGB565 display, a full-screen clear alone costs the CPU approximately 150 K write operations per frame. Add widget compositing and the CPU never idles between frames, starving application logic and RTOS communication tasks.
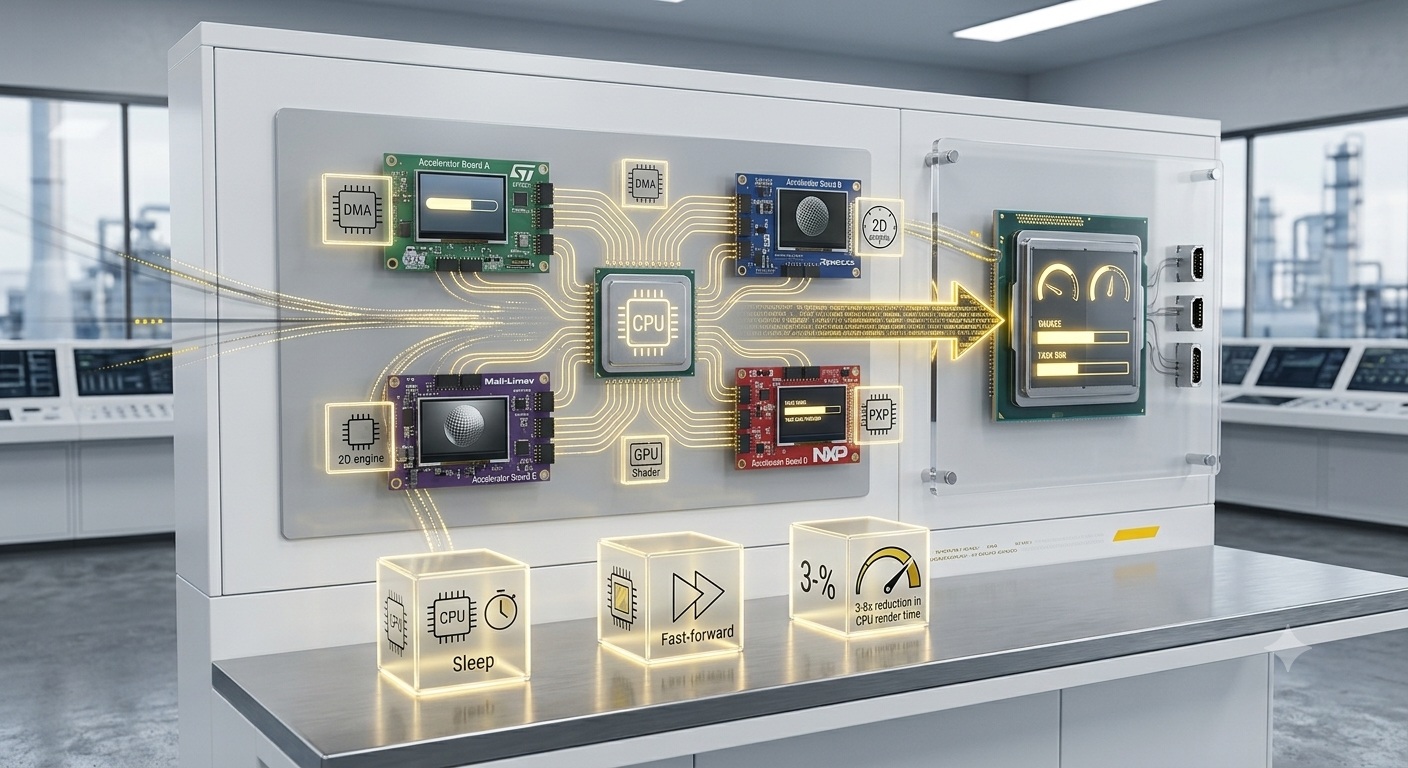
How Sparklet solves it: Sparklet's GDI (Graphics Device Interface) layer abstracts hardware accelerators behind a common API. On STM32 targets, DMA2D handles fill, copy, and alpha blend operations in parallel with CPU execution. On Renesas RH850/RA targets, D/AVE2D and the Mali-Limav GPU take over blit and compositing. On NXP i.MX platforms, PXP and the 2D GPU accelerate pixel operations. Application code calls identical GDI functions regardless of target — the HAL binds whichever accelerator is available.
- Supported accelerators: DMA2D (STM32), D/AVE2D (Renesas RH850/RA), Mali-Limav (RA8D1), PXP (NXP i.MX RT)
- CPU is free for application logic while DMA handles pixel operations
- No manual accelerator API calls required in application code
- Typical improvement: 3–8× reduction in CPU render time per frame on STM32H7 with DMA2D
Root Cause 3: Framebuffer Placed in Slow External SDRAM
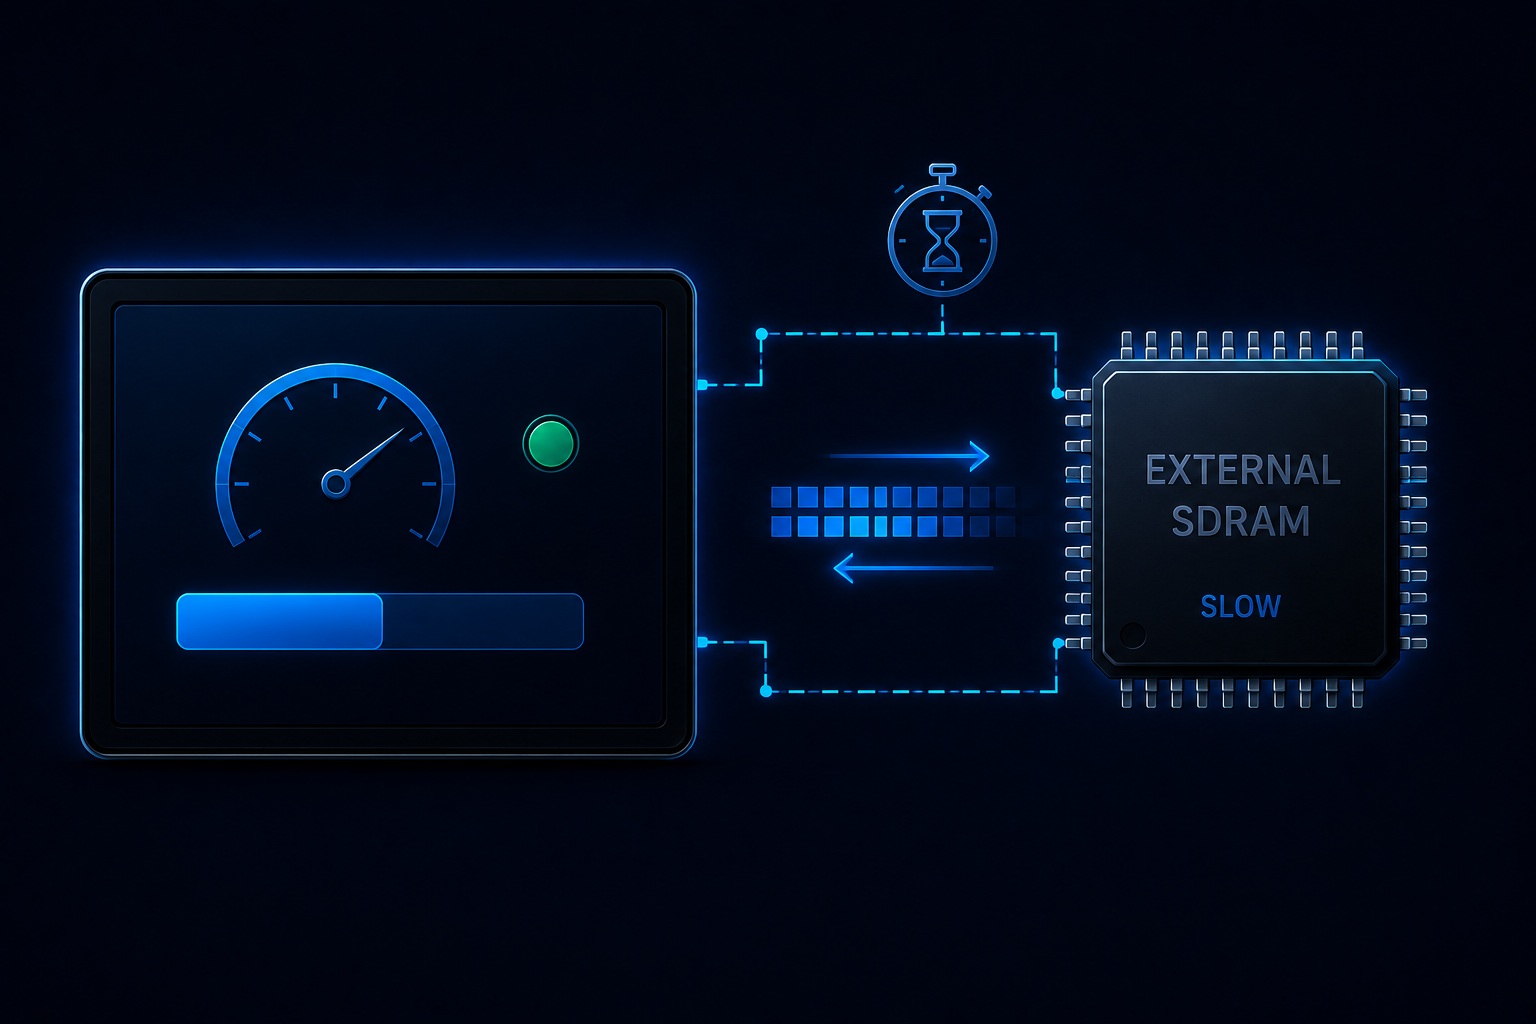
When the active framebuffer lives in external SDRAM — common when internal SRAM cannot fit a full 320×240×2 = 150 KB buffer — every pixel write crosses the external memory bus. SDRAM latency is 5–10× higher than internal SRAM. The renderer stalls waiting for bus access, compressing effective throughput far below theoretical pixel fill rate even with a fast CPU clock.
How Sparklet solves it: Sparklet supports rendering into a partial buffer — a RAM region covering only a subset of display scan lines, as small as 10 lines for a 320-wide display (320×10×2 = 6.4 KB). The renderer makes multiple passes, flushing each strip to the display via DMA while computing the next strip in parallel. This eliminates the need for external SDRAM entirely and allows the renderer to operate from fast internal SRAM regardless of display resolution.
- Partial buffer as small as 10 scan lines — 6.4 KB for 320-wide 16-bit display
- DMA flush of one strip overlaps CPU computation of the next strip
- Enables high-resolution displays on MCUs with only internal SRAM
- See full technique: Reduce Embedded GUI Memory Usage
Root Cause 4: Over-Allocated Widget Tree With All Items Instantiated
Keeping hundreds of off-screen widgets active — all items in a long list simultaneously instantiated, for example — means every invalidation pass iterates them all. Widget trees exceeding available RAM also trigger heap fragmentation, causing unpredictable allocation latency mid-frame. Only visible widgets should be active at any time.
How Sparklet solves it: Sparklet's ScrollView and ListView widgets implement virtual scrolling. Only the visible rows are instantiated as widget objects. As the user scrolls, Sparklet recycles widget instances and rebinds data. For a 1000-item list, only 8–12 widget instances exist in memory at any time. Off-screen items carry zero render budget cost. This also eliminates heap fragmentation from repeated create/destroy cycles.
- Virtual scrolling built into ScrollView and ListView — no application code required
- Fixed widget pool — no heap allocation per scroll event
- Data binding via callback — application provides row data on demand
- See the full widget catalogue: Widget Library

Root Cause 5: Font Rendering Without a Glyph Cache
Anti-aliased font rendering in software requires per-pixel alpha calculations and gamma correction. Rasterising even a short string at 24 pt anti-aliased costs thousands of multiply-accumulate operations per frame. Without a glyph cache, this repeats identically every frame for output that has not changed — burning CPU cycles on pure duplication with zero benefit to the displayed result.
How Sparklet solves it: Sparklet pre-renders glyphs into a font cache at startup or on first use. Subsequent draws of the same character at the same point size read from the cache rather than rasterising from the font descriptor. For a typical numeric display (digits 0–9 plus colon and decimal point) the full cache fits in a few kilobytes and renders characters at memory-copy speed, not software-rasteriser speed. Flint UI Designer exports fonts in Sparklet's pre-processed binary format — no runtime parsing overhead.
- Automatic glyph cache — no application configuration required
- Cache size proportional to character set and point sizes used
- Flint exports fonts in Sparklet's pre-processed binary format — no runtime parsing
- Compatible with compressed font storage to reduce Flash footprint