
As embedded systems continue to evolve, user interfaces are expected to display increasing amounts of information in a clear and organized manner. Whether monitoring machine performance, viewing diagnostic information, displaying configuration data, or presenting operational records, users need an efficient way to access structured information without overwhelming the display.
Presenting large amounts of data using individual labels or custom layouts can quickly become difficult to manage, especially when information is arranged in rows and columns. This is where the Table Widget in Sparklet becomes an invaluable component.
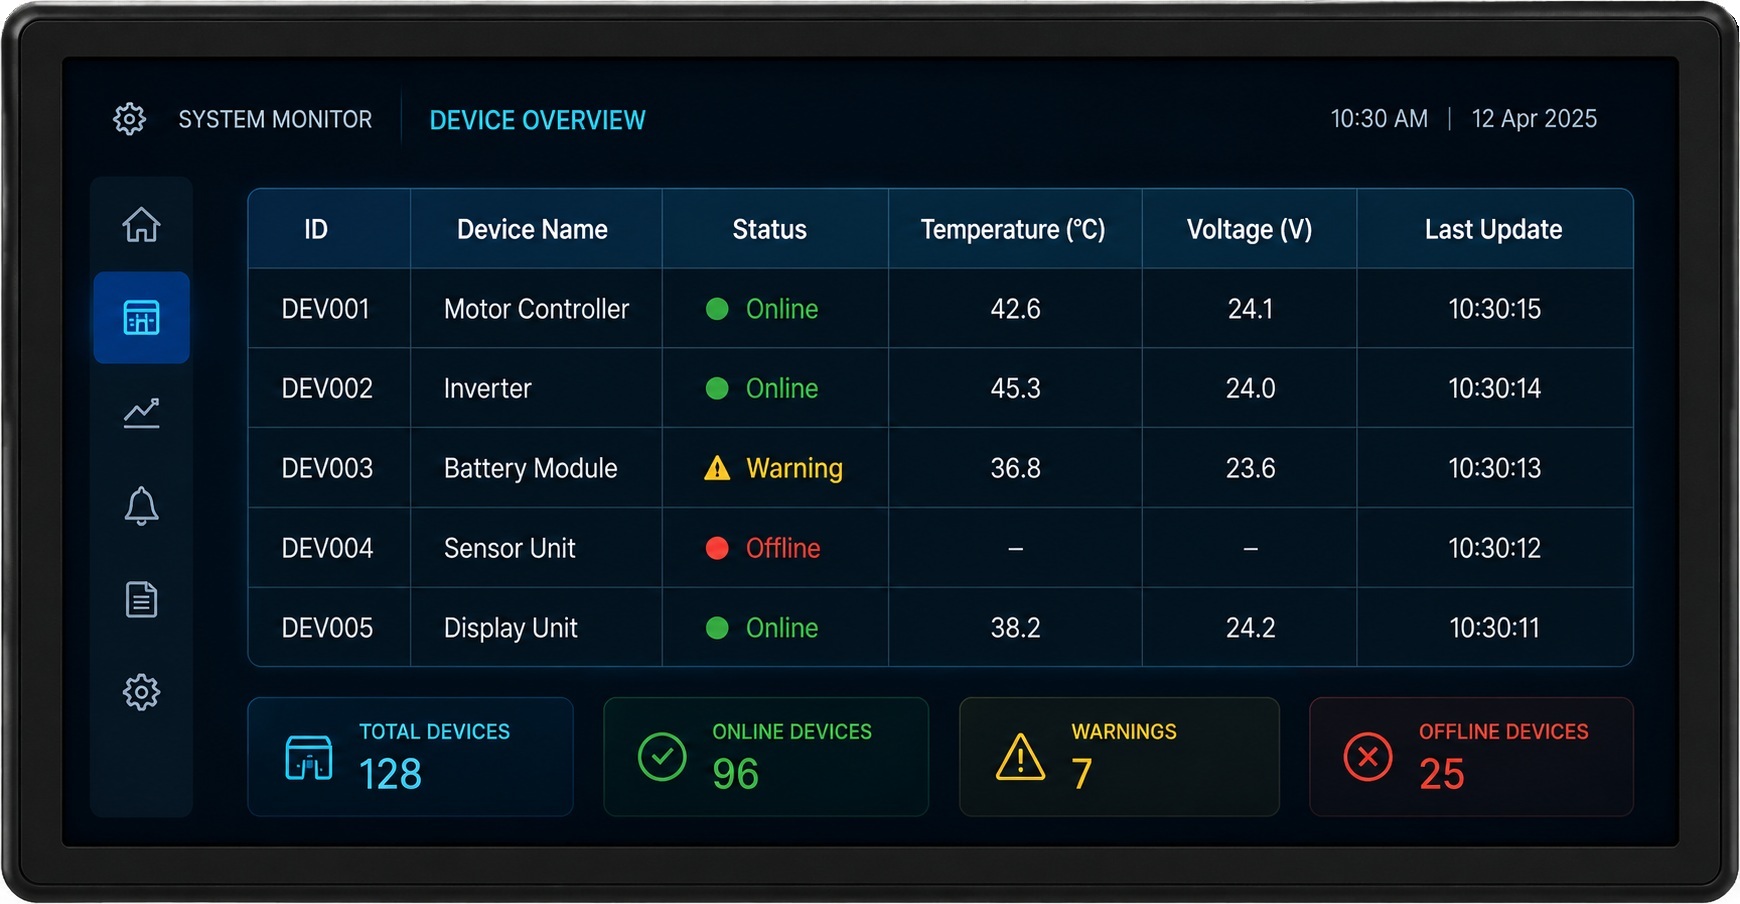
The Table Widget provides a structured way to display information in a familiar tabular format, making it easier for users to read, compare, and analyze data directly on embedded displays. With support for configurable columns, headers, row formatting, separators, fonts, and scrolling capabilities, the widget helps developers build organized and professional-looking interfaces for a wide range of embedded applications.
In this article, we explore the Table Widget, its key capabilities, practical applications, and the advantages it brings to embedded UI development.
Why Structured Data Presentation Matters
Embedded devices often need to present multiple pieces of related information simultaneously. As the amount of displayed information increases, maintaining clarity becomes increasingly important. Consider applications that display:
- Sensor readings
- Production statistics
- User records
- Network information
- Historical measurements
When this information is presented in an unstructured manner, users may struggle to locate and interpret the data they need.
A table-based layout solves this problem by organizing information into rows and columns, allowing users to quickly identify relationships between values and compare data efficiently.
The Table Widget provides this capability while maintaining a clean and professional user experience.
What is the Table Widget?
The Table Widget is a UI component designed to display structured information in a grid format.
Data is organized into:
- Columns
- Rows
- Header sections
- Individual cells
Each row typically represents a record, while columns define specific attributes associated with that record.
Flexible Table Configuration in Sparklet
The Table Widget offers several configuration options that allow developers to tailor the layout according to application requirements.
Developers can configure: Number of columns, Header height, Row height, Column widths, Column alignment, Header names, Scroll bar support, Row and column separators
These properties provide flexibility when designing tables for different screen sizes and use cases.
For example, a compact display may require fewer columns with abbreviated headers, while a larger industrial panel may present more detailed information across multiple columns.
The ability to customize table dimensions ensures optimal utilization of available screen space.
Customizing Table Headers
Headers play an important role in helping users understand the displayed information.
The Table Widget allows developers to configure: Header names, Header widths, Horizontal alignment, Vertical alignment, Header background colors
Clearly defined headers improve readability and help users quickly identify the meaning of each column.
Properly designed headers significantly improve data interpretation, especially when tables contain large numbers of rows.
Enhancing Readability Through Visual Styling
One of the biggest challenges when displaying large amounts of information is maintaining readability.
The Table Widget includes several visual customization options that improve data visibility and user experience.
Developers can configure: Alternate row colors, Header text colors, Cell text colors, Selected row colors, Selected text colors, Separator colors, Header fonts and Cell fonts.
Alternating row colors are particularly useful because they help users visually track data across wide tables.
Similarly, customizable fonts and colors allow the table to match the overall design language of the embedded application.
Whether building an industrial HMI, automotive display, or medical interface, consistent styling helps create a polished user experience.
Supporting Large Data Sets
Many embedded applications need to display more information than can fit within a single screen.
The Table Widget addresses this challenge through optional scroll bar support.
When enabled, scrolling allows users to access additional rows without requiring multiple screens or complex navigation mechanisms.
This capability is especially valuable for applications such as:
- Event logs
- Alarm histories
- Diagnostic records
- Production reports
- User management lists
By supporting larger datasets within a single interface component, the widget helps simplify screen design while improving usability.
Real-World Applications of Table Widgets
The Table Widget is widely used across multiple industries because structured data presentation is a common requirement in embedded systems.
Industrial Automation
Industrial HMIs frequently display operational information in table format. Examples include:
- Machine status lists
- Production reports
- Maintenance schedules
- Alarm logs
- Sensor monitoring data
Operators can quickly identify trends and system conditions using organized tabular layouts.
Medical Devices
Healthcare equipment often presents patient or system data in structured formats. Examples include:
- Measurement records
- Device diagnostics
- Monitoring results
- Historical trends
Tables provide healthcare professionals with a clear and efficient method for reviewing information.
Automotive Systems
Vehicle diagnostics and fleet management applications commonly use tables to display:
- Fault codes
- Service history
- Sensor data
- Vehicle status reports
The structured layout improves readability and simplifies troubleshooting.
Energy and Utility Systems
Energy monitoring applications frequently display:
- Power consumption records
- Meter readings
- System alerts
- Equipment status
A table-based presentation helps users analyze operational performance efficiently.
Benefits of Using the Table Widget
The Table Widget provides several advantages that make it a valuable component in embedded UI development.
Organized Data Presentation
Information is displayed in a structured format that users can easily understand.
Improved Readability
Rows, columns, headers, and configurable styling make large datasets easier to navigate.
Efficient Use of Screen Space
Multiple records can be displayed simultaneously without requiring additional screens.
Flexible Customization
Developers can tailor layouts, colors, fonts, and dimensions to suit application requirements.
Scalable Design
The widget supports both small and large datasets through configurable scrolling and column management.
Familiar User Experience
Tables are widely recognized across industries, reducing the learning curve for users.
Best Practices for Table Design
To maximize usability, developers should keep column headers concise and meaningful.
Column widths should be optimized to prevent text truncation while maintaining a balanced layout.
Using alternating row colors can improve readability, particularly when tables contain many records.
High-contrast text and background colors should be selected to ensure visibility under different lighting conditions.
Finally, only the most relevant information should be displayed to avoid overwhelming users with excessive data.
A well-designed table should help users find information quickly rather than requiring extensive scanning.
Why Table Widgets Are Essential in Modern Embedded UI
As embedded devices continue to process and display more information, the need for effective data presentation becomes increasingly important.
Users expect interfaces that allow them to view, analyze, and interpret information quickly. The Table Widget fulfills this requirement by providing a structured and scalable way to display large amounts of data within a compact area.
Its flexibility, readability, and familiarity make it a key component for many embedded UI applications.
Conclusion
The Table Widget in Sparklet provides a powerful solution for displaying structured information in embedded systems. With configurable columns, customizable headers, flexible styling options, row and column separators, and optional scrolling support, it enables developers to present complex datasets in a clear and organized manner.
Whether used in industrial automation systems, medical devices, automotive diagnostics, or energy monitoring applications, the Table Widget helps transform raw data into meaningful information that users can quickly understand and act upon.
By leveraging the Table Widget, developers can create professional, scalable, and user-friendly embedded interfaces that improve both usability and operational efficiency.
https://sparkletui.com/documentation/flint-ui-designer/widgets/widgets.html#table-widget